High satisfaction among our users
Now the results from the user satisfaction survey 2022 are ready. We thank all who chose to participate with ratings, feedback and valuable input to develop our services further.
The survey, which is conducted yearly, aims to determine overall user satisfaction and allow the user community to provide feedback and point to areas that need increased attention from Sigma2 in the time to come. All project managers and users of the national e-infrastructure services were invited to participate.

We are glad to see that you value our services and coordination efforts. Below are some extracts from the survey showing how you assessed our services, operations and activities in 2022 compared to 2021. The 2021 figures are presented in brackets after the 2022 figures.
Survey result summary
User support and coordination services
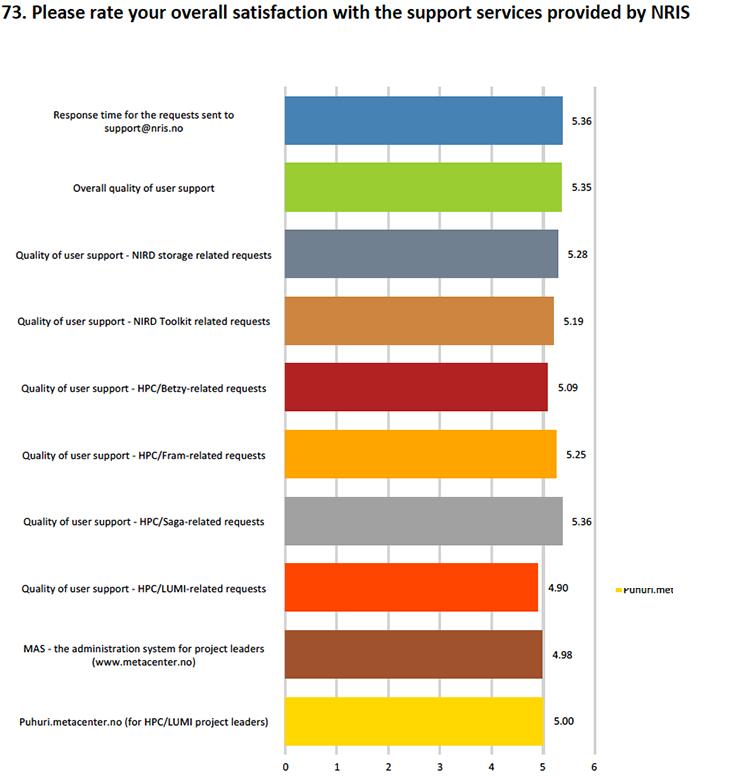
Like previous surveys, the respondents convey high satisfaction with the support and coordination services provided for project managers and users. Here´s a selection of variables rated in the annual user survey:
(Scores are given on a scale from 1 to 6, where 1 is poor and 6 is excellent)
- 5.10 (5.10) — Overall satisfaction with Storage services
- 5.20 (5.10) — Overall satisfaction with Computing services
- 5.40 (5.30) — Overall satisfaction with User support
- 5.50 ( — ) — Overall satisfaction of Advanced user support
- 5.28 (5.10) — Project application procedure and feedback on applications
- 5.56 (5.36) — Response time for applications for extra resources
- 4.84 (4.94) — Information available on www.sigma2.no (administrative documentation
- 4.86 (4.95) — Information available on www.documentation.sigma2.no (technical documentation
- 4.82 (4.83) — Information available on opslog.sigma2.no (operational information)
We see a minor decrease in the ratings of the variables related to information compared to last year. However, compared with outcomes from earlier years, the scores of our websites have stabilized just below the score of 5.
We will continue to lay our effort into developing and improving user documentation. Also, because of feedback we have previously received from users regarding how we provide information about system maintenance and downtime, we are in the process of putting a new and more dynamic notification system into use.
Additional information about the coordination and support services variables is presented below:


Satisfaction with the storage services
Of the total number of users of the NIRD services, 94% uses the storage service, compared to 96% the year before. The number of users on the following services has increased slightly:
- 21% use the archive (17% )
- 15% use the easyDMP (13%)
- 19% use NIRD Toolkit and the NIRD Service Platform (18%)
This year`s survey suggests a slight increase in respondents who use the entire NIRD services portefolio as a whole-purpose platform and exploit the potential in accessing the whole ecosystem (data planning, storage, analysis and archiving). The majority of users are, however, still using NIRD only for storage purposes, indicating that the data are either not consumed but only collected or consumed “locally” / elsewhere. This is the scores of the storage related services:
(Scores are given on a scale from 1 to 6, where 1 is poor and 6 is excellent)5.20 (5.16) — NIRD Data Storage overall (N=102)
- 5.22 (4.87) — NIRD Research Data Archive overall (N=23)
- 5.06 (4.57) — NIRD easyDMP overall (N=16)
- 4.40 (4.70) — NIRD Service Platform / Toolkit overall (N=20)
Satisfaction with the HPC service
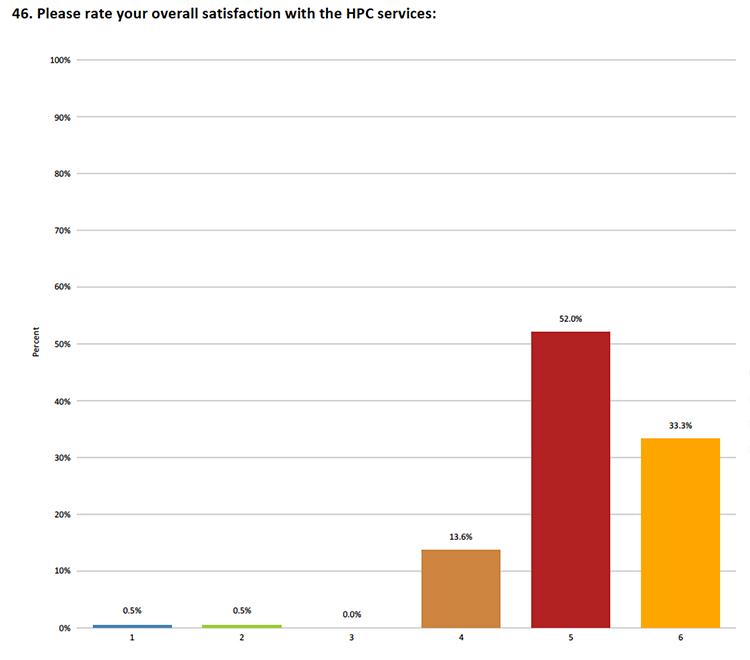
The HPC service satisfaction vector in the period from 2022-2018 is (5.2, 5.1, 4.8, 4.8, and 4.9), showing a significant improvement over the last two years. This year’s survey included free text input for follow-up actions on the user environment functionality and HPC service improvements. This feedback can be classified into the following categories: System, queue system and MAS, User support (services only), LUMI and Other. N=197.

Satisfaction with the Advanced User Support (AUS) service
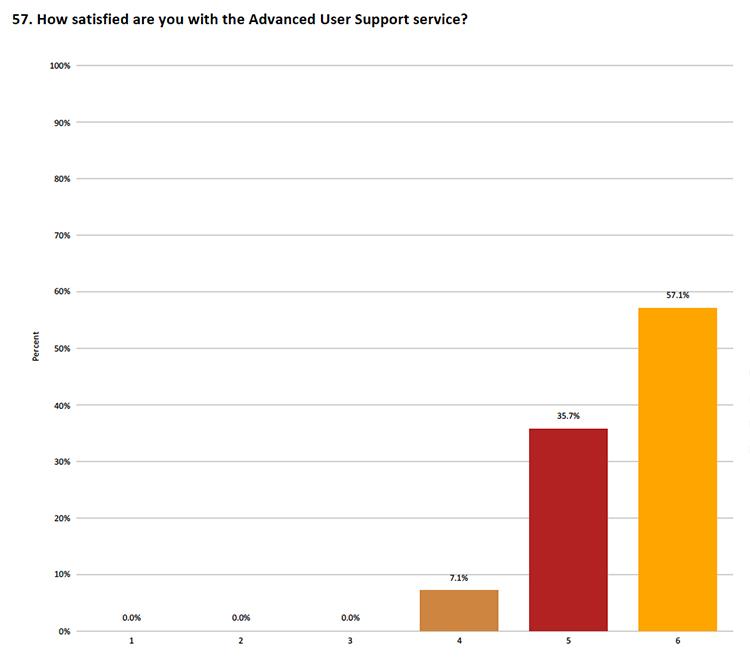
Those of our respondents who have used the AUS service expressed great satisfaction. In total, 57.1% scored 6, and 35.7 % scored 5, which is relatively stable compared to the average score from last year when 58.3 % scored 6, and 33.3% scored 5. N=16.

We strongly encourage our users to consider using AUS to improve e.g. your software or your data management.
About the survey
The survey, containing 48 questions including multiple free text fields, was distributed to all users by email. The survey was open in the period between 5-31 January. A total of 223 users responded, including users from the Sigma2 partner sites (the universities in Bergen, Oslo, Tromsø, and NTNU) and other user groups. Approximately 1 in 3 respondents reported answering the survey on behalf of the other users in their projects, thus giving us a total reach of potentially 750 users. The survey was anonymous, and all answers were treated confidentially
How do we use the results?
All replies and feedback from our users are valuable to us, and it is thus somewhat unfortunate to see a decrease in response rate, from 20,5 % in 2021 to 12,5 % in 2022. However, we are now back to a similar response rate as before 2021. We use the survey results actively to improve operations and support and plan future service development.
Many of your inputs related to services initiatives are put into the services roadmaps, which you can follow on our services pages on the sigma2 website.
If you have questions regarding the survey, or you wish to direct our attention towards additional matters, you are welcome to contact us at contact@sigma2.no